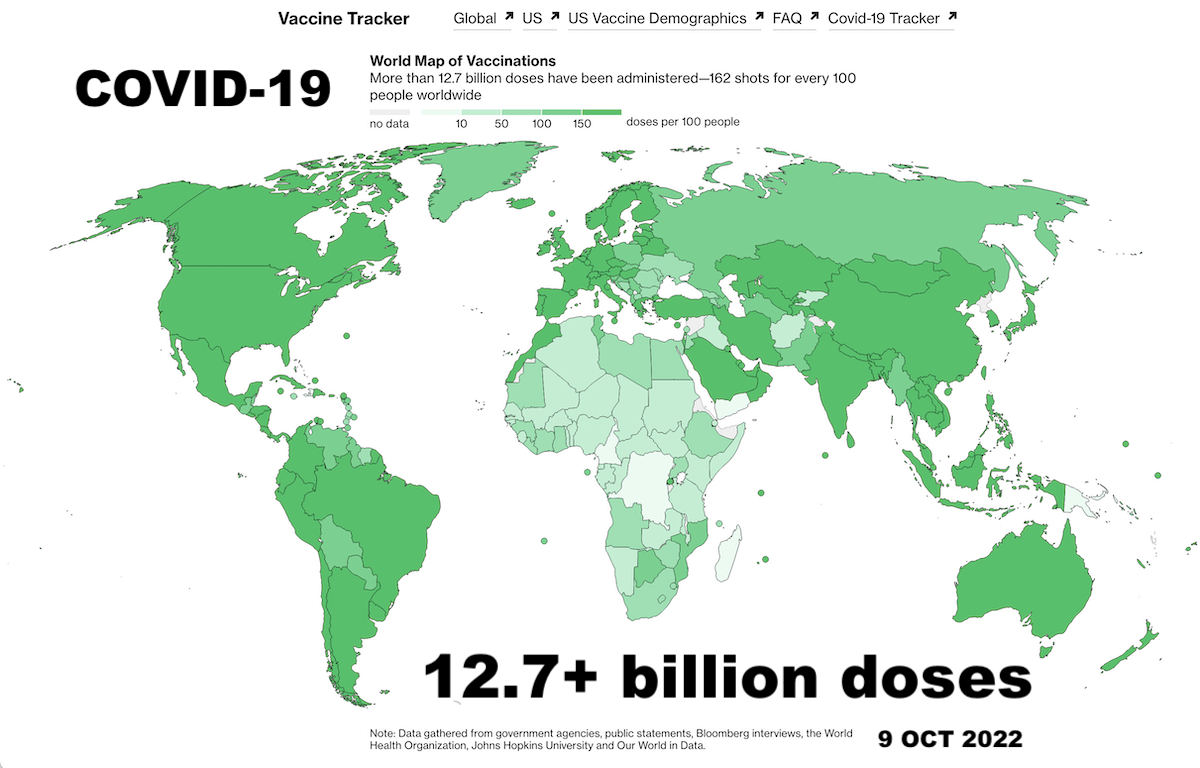
More Than 12.7 Billion Shots Given: Covid-19 Tracker In the US, 613 million doses have been administered
Updated: 6 October 2022
Data Source: Bloomberg Covid-19 Vaccine Tracker Open Data
A note to readers: As of Oct. 5, 2022 the Bloomberg Vaccine Tracker has stopped updating, as has our GitHub page. More information about this change can be found here. This page will continue to live on as an archived version. Over a year into the biggest vaccination campaign in history, more than 12.7 billion doses have been administered across 184 countries, according to data collected by Bloomberg. The latest rate was roughly 7.07 million doses a day. In the US, 613 million doses have been given so far. During the last week, shots were administered at an average rate of 30,866 doses a day.
The Legacy of Omicron
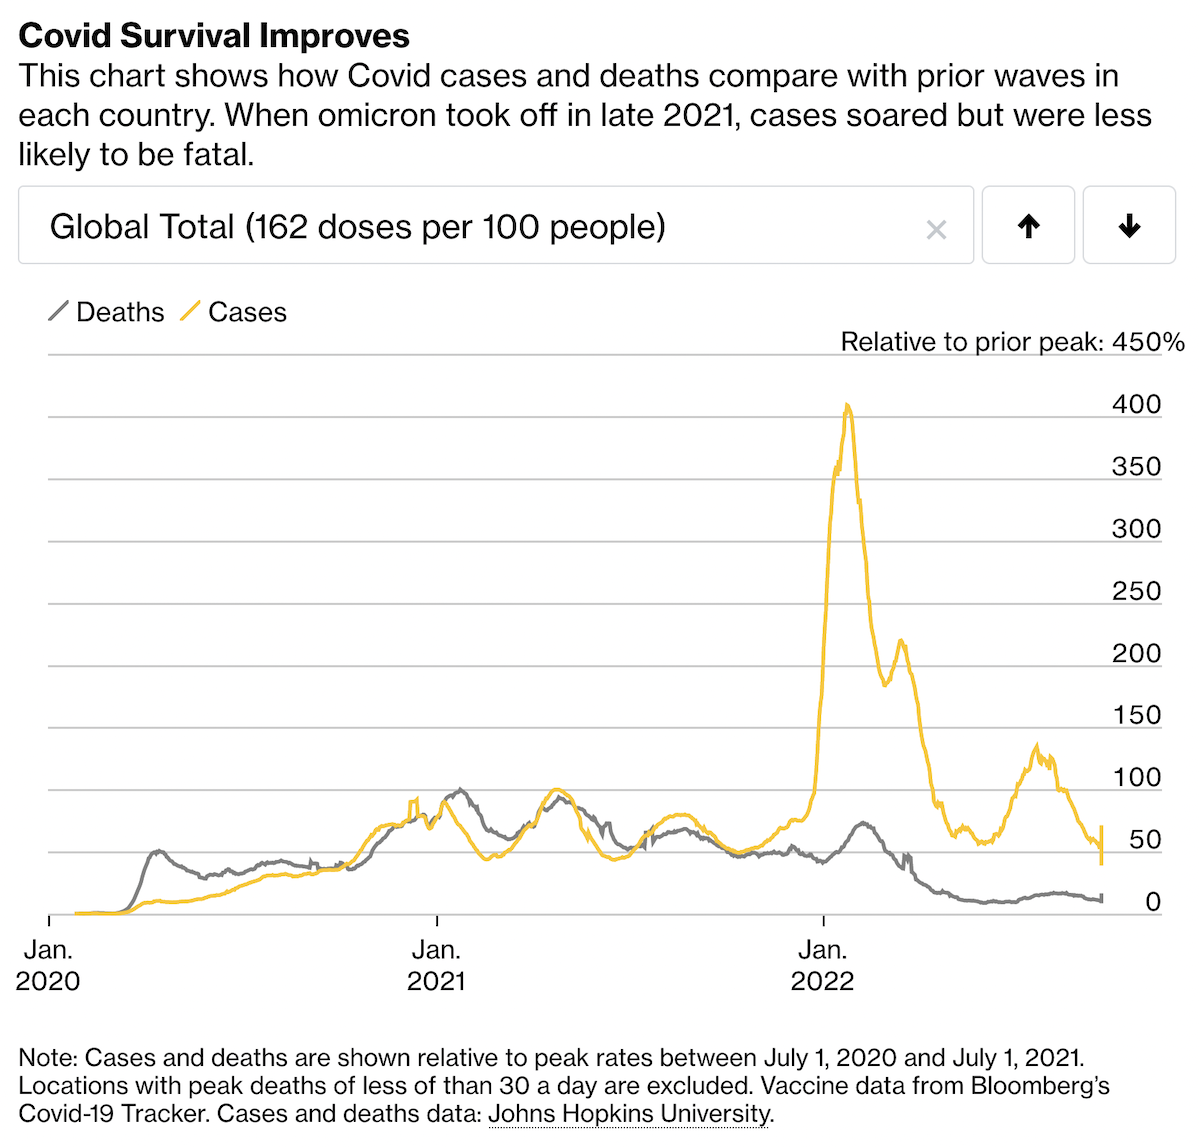
The Covid-19 vaccine has changed the course of the pandemic. In total, 162 doses have been given for every 100 people around the world. In countries that reached the highest levels of vaccination, death rates plummeted.
Amid this progress, the world was caught off guard when the omicron variant rose to prominence in late 2021. Omicron proved somewhat less severe than previous variants, but it spread much faster.
Millions of vaccinated people have gotten sick from the omicron strain, but the shots served their most important function—preventing severe illness. During the omicron wave, vaccination with a booster reduced the chance of hospitalization and death by more than 90%. Sudden spikes of cases from the fast-moving variant have pressured health systems, but the outlook for the average Covid patient has improved significantly.
Covid Survival Improves
This chart shows how Covid cases and deaths compare with prior waves in each country. When omicron took off in late 2021, cases soared but were less likely to be fatal.
Global Total (162 doses per 100 people)
‘Pandemic of the Unvaccinated’
In early 2021, Israel was first to show that vaccines were bending the curve of Covid infections. The country led the world in early vaccinations, and cases declined rapidly. A similar pattern of vaccination and recovery was repeated across dozens of countries.
New, more transmissible variants caused renewed outbreaks, but in these subsequent waves, unvaccinated patients faced far higher risk of hospitalization and death. This disparity in outcomes led health officials to dub the current phase of Covid a “pandemic of the unvaccinated.”
Since the start of the global inoculation campaign, countries have experienced unequal access to vaccines and varying degrees of success in getting shots into people’s arms.
Race to End the Pandemic
Cuba leads the world with 369 doses administered per 100 people
Doses per 100 people: 400
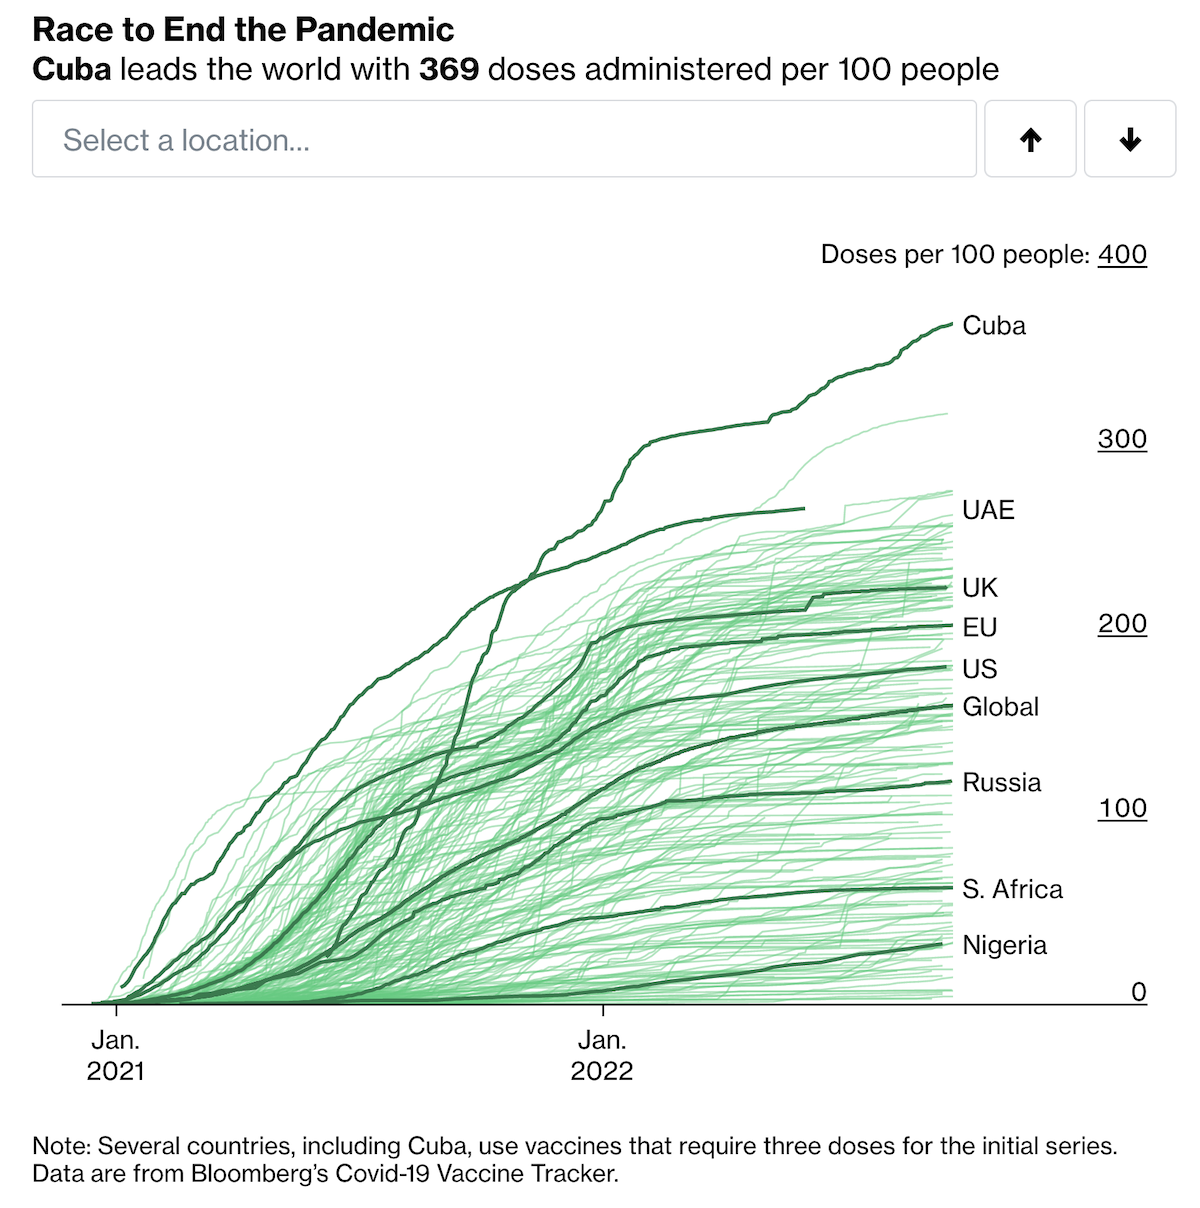
Note: Several countries, including Cuba, use vaccines that require three doses for the initial series. Data are from Bloomberg’s Covid-19 Vaccine Tracker.
Watch: Inside the Biggest Vaccine Campaign in History
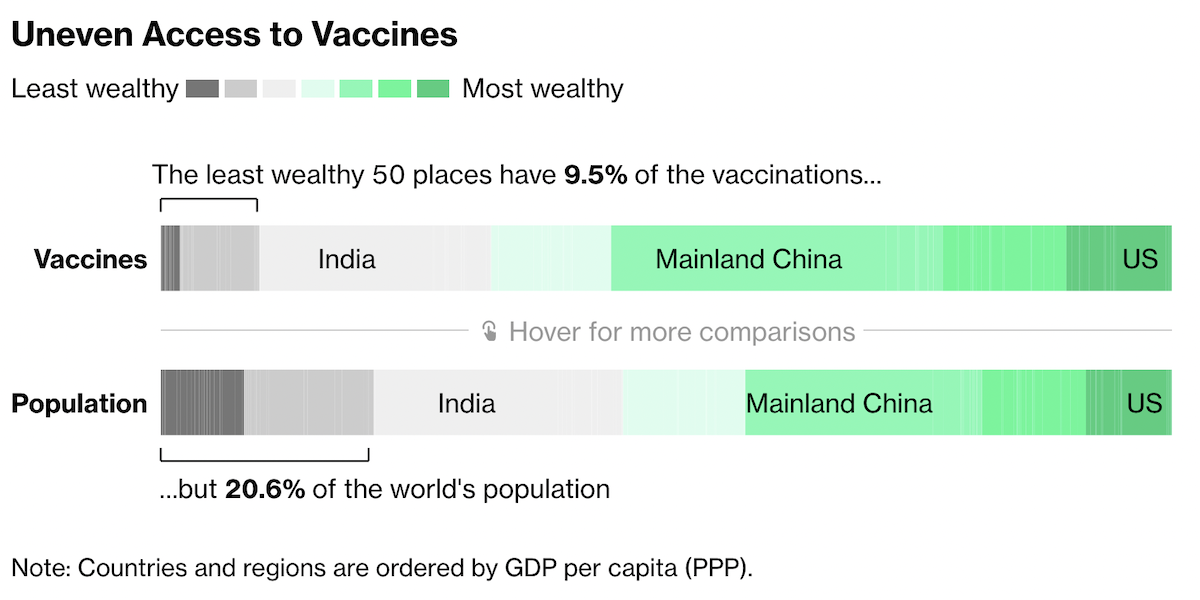
In the first two years after a pandemic was declared, a dozen new vaccines were developed and more than 10 billion doses were administered. The rollout was unprecedented in its speed and scope, but distribution has been lopsided. Countries with the highest incomes have been vaccinated 10 times faster than those with the lowest.
Delivering billions of additional doses to some of the world’s least-equipped nations remains one of the biggest challenges for global health.
Uneven Access to Vaccines

Note: Countries and regions are ordered by GDP per capita (PPP).
When Will Life Return to Normal?
While the best vaccines are highly effective at preventing hospitalizations and deaths, it takes a coordinated campaign to stop a pandemic. Infectious-disease experts have said that vaccinating 70% to 85% of the population could enable a return to normalcy, with booster shots needed to keep the virus in check.
On a global scale, that’s a daunting level of vaccination. Currently, 77 places have given at least one dose to 75% of the population. At the current pace of vaccinations, the goal of halting the pandemic remains elusive. Some countries are now reassessing their pandemic-era policies—weighing the current risk of severe illness against fatigue with public health measures.
The Path to Immunity Around the World
Globally, the latest vaccination rate is 7,072,252 doses per day, which includes 1,952,005 people people getting their first shot. At this pace, it will take another 10 months until 75% of the population has received at least one dose.
Global Total (10 months to 75% coverage)
Doses administered: 100 M
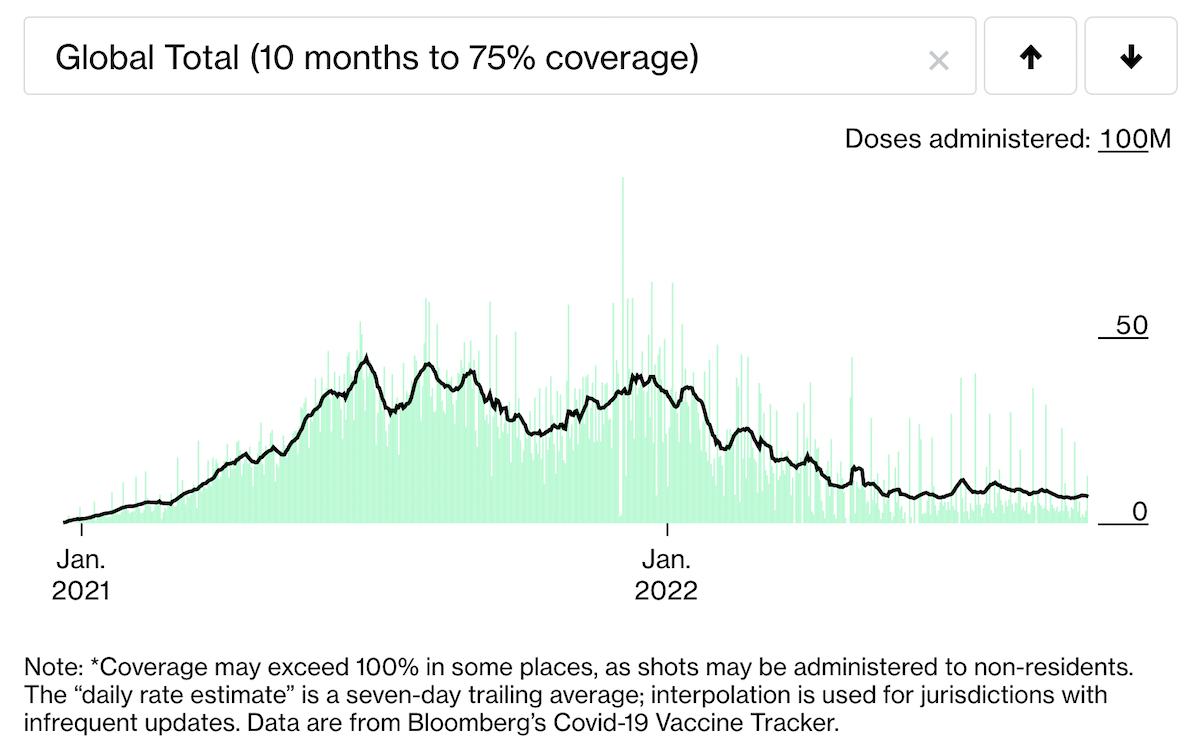
Note: *Coverage may exceed 100% in some places, as shots may be administered to non-residents. The “daily rate estimate” is a seven-day trailing average; interpolation is used for jurisdictions with infrequent updates. Data are from Bloomberg’s Covid-19 Vaccine Tracker.
Global Vaccination Campaign
| % of population | ||||||
|---|---|---|---|---|---|---|
| Countries and regions | Doses administered | Doses per 100 people | given 1+ dose | fully vaccinated | booster dose | Daily rate of doses administered |
| Global Total | 12,749,150,878 | – | – | – | – | 7,072,252 |
| Mainland China | 3,452,957,751 | 244.1 | 92.4 | 89.8 | – | 23,785 |
| India | 2,170,901,372 | 157.5 | 74.4 | 68.7 | 14.2 | 1,610,272 |
| EU | 912,125,323 | 205.3 | 76.1 | 73.6 | 56.8 | 162,980 |
| US | 612,825,646 | 182.8 | 78.6 | 67.0 | 32.5 | 261,820 |
| Brazil | 479,103,959 | 226.3 | 88.2 | 81.3 | 55.9 | 303,196 |
| Indonesia | 437,022,061 | 161.7 | 75.5 | 63.1 | 22.9 | 100,644 |
| Japan | 321,716,025 | 255.6 | 82.8 | 81.7 | 91.2 | 209,474 |
| Bangladesh | 298,376,565 | 181.2 | 79.9 | 73.9 | 27.4 | 123,675 |
| Pakistan | 295,464,617 | 141.7 | 66.8 | 63.1 | 20.7 | 145,462 |
| Vietnam | 258,223,943 | 265.1 | 92.1 | 85.9 | 69.9 | 109,001 |
| Mexico | 209,673,612 | 164.1 | 75.9 | 62.6 | 44.6 | 70,622 |
| Germany | 185,226,682 | 222.7 | 77.9 | 76.3 | 71.3 | 34,548 |
| Russia | 176,836,345 | 121.0 | 57.8 | 52.5 | 12.2 | 212,363 |
| Philippines | 163,734,141 | 150.5 | 71.1 | 66.7 | 16.6 | 111,250 |
| Iran | 154,329,909 | 183.4 | 77.3 | 69.4 | 36.4 | 26,698 |
| France | 153,044,712 | 235.0 | 83.8 | 81.5 | 66.4 | 17,188 |
| Turkey | 152,230,610 | 182.1 | 69.3 | 63.6 | 49.2 | 9,989 |
| UK | 151,871,541 | 226.4 | 69.6 | 65.6 | 51.8 | 501,577 |
| Thailand | 143,100,880 | 205.0 | 81.6 | 76.6 | 45.8 | 15,836 |
US Vaccinations: State by State
Once the envy of the world for its swift vaccine rollout, the US has since been overtaken by dozens of countries. Wide gaps opened up between the most and least vaccinated counties in the US, leaving many communities vulnerable to continued outbreaks. The country’s booster campaign lags behind most wealthy nations.
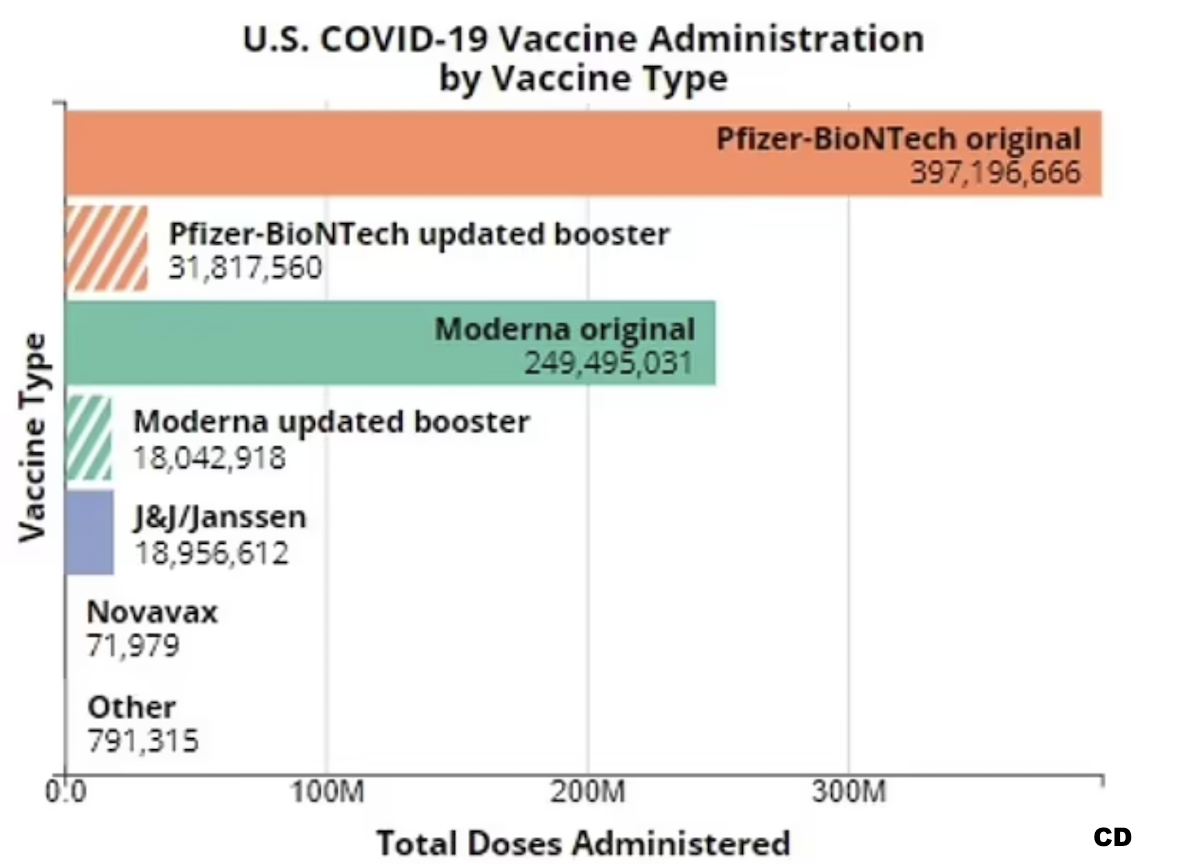
So far, 263 million Americans have received at least one dose of a vaccine—78.6% of the population. At least 225 million have completed a vaccination regimen and 109 million have received boosters.
The US has pledged to send 1.1 billion doses to other hard-hit regions of the world by the end of 2022.
Vaccines Across America
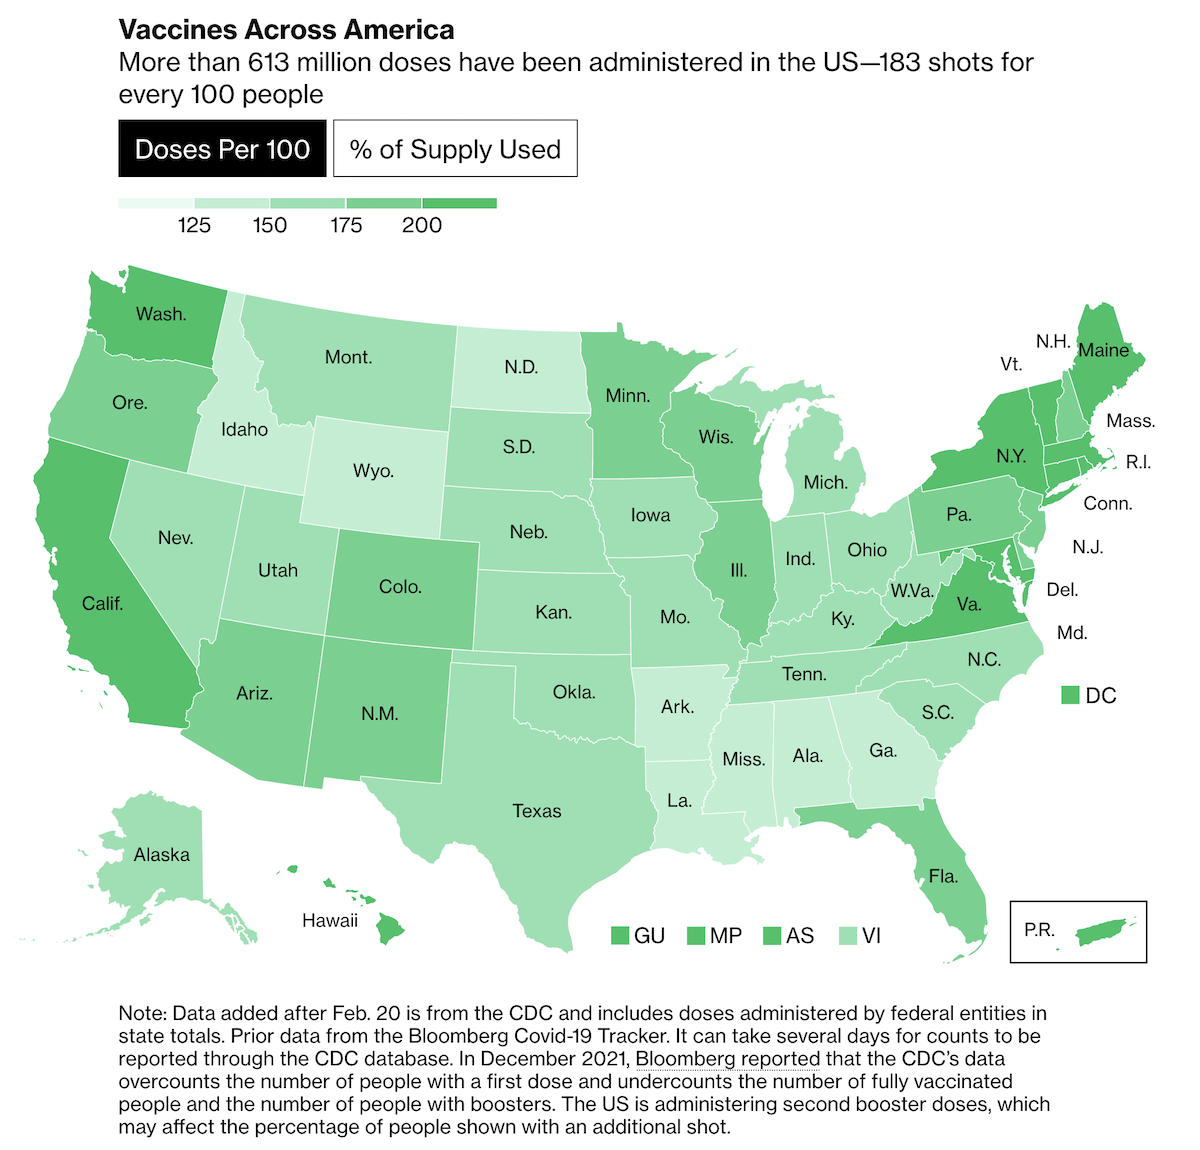
More than 613 million doses have been administered in the US—183 shots for every 100 people
Note: Data added after Feb. 20 is from the CDC and includes doses administered by federal entities in state totals. Prior data from the Bloomberg Covid-19 Tracker. It can take several days for counts to be reported through the CDC database. In December 2021, Bloomberg reported that the CDC’s data overcounts the number of people with a first dose and undercounts the number of fully vaccinated people and the number of people with boosters. The US is administering second booster doses, which may affect the percentage of people shown with an additional shot.
A new beginning
In the early months of vaccination, Americans flocked to mass-inoculation sites set up at sport stadiums, theme parks, convention halls and race tracks. The vaccination rates were similar across states and demographics, according to a Bloomberg analysis. That changed. Amid pandemic fatigue and fraying political discourse, vaccination rates split along political lines.
The US suffered some of the highest rates of severe illness among its peers—with tens of thousands of vaccine-preventable deaths. Still, as omicron cases subsided in February, even states with some of the most restrictive covid measures began to reassess their health rules. The uncoupling of cases and deaths during the winter omicron wave suggested a potential end to the emergency phase of pandemic.
The Uncoupling of Cases and Deaths in the US
Effective vaccines and milder Covid variants led to significantly higher survival rates by 2022.
United States (183 doses per 100)
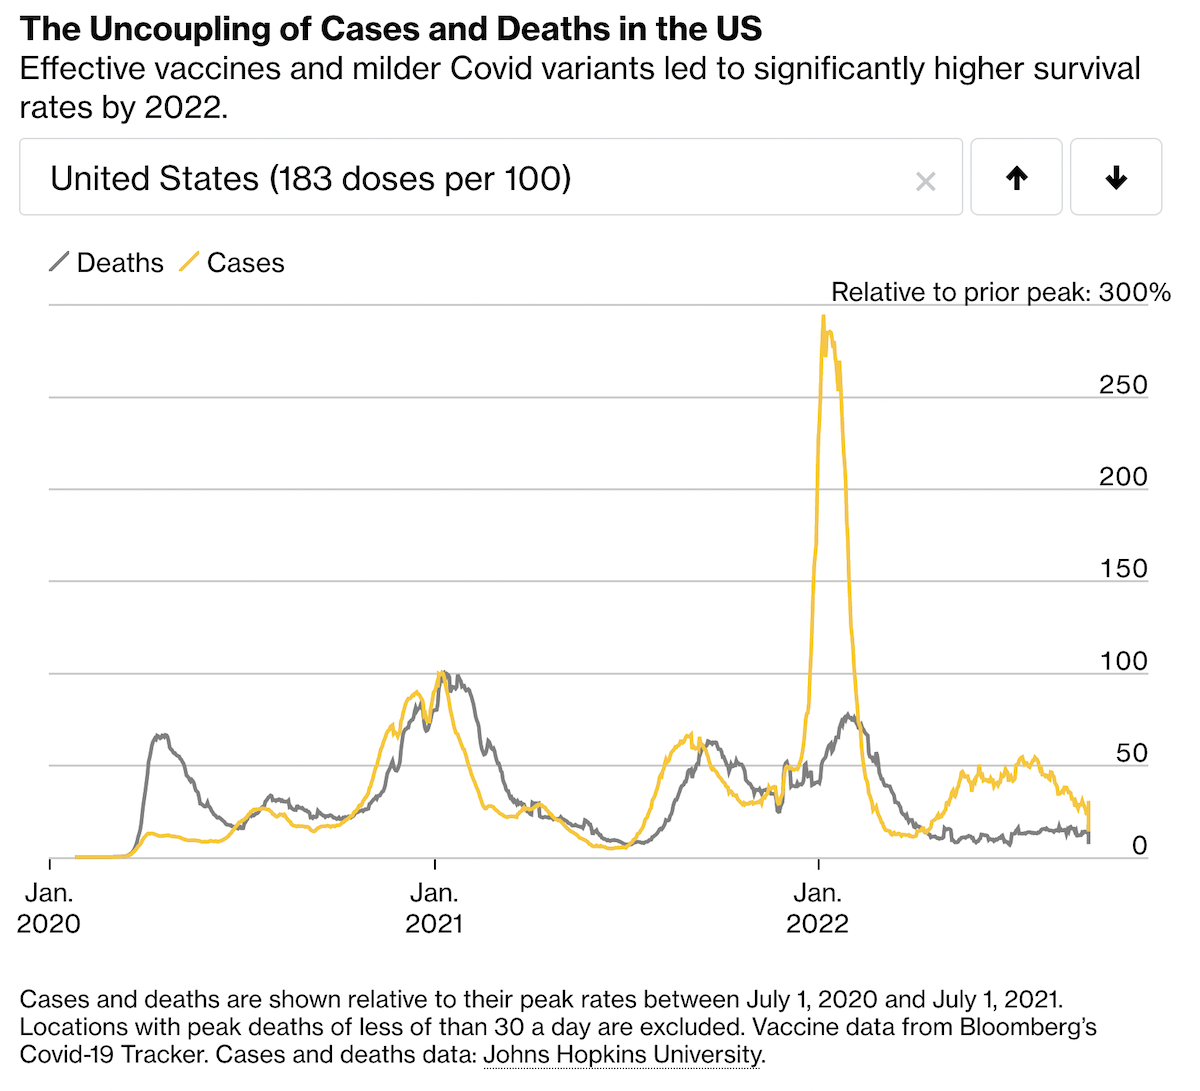
Cases and deaths are shown relative to their peak rates between July 1, 2020 and July 1, 2021. Locations with peak deaths of less of than 30 a day are excluded. Vaccine data from Bloomberg’s Covid-19 Tracker. Cases and deaths data: Johns Hopkins University.
Even with the decoupling, the flood of omicron cases killed thousands of people a day during the winter peak. US health officials are now focused on how to encourage vaccinations among people who’ve shown reluctance, and to provide boosters to those who haven’t gotten around to it. In some areas of the country with low rates of vaccination, the number of people signing up for shots has slowed to a trickle.
It takes about two weeks after a final vaccine dose for immunity to fully develop. The CDC recommends a booster five months after completing a regimen of Pfizer or Moderna and two months after a J&J vaccination.
How State Vaccinations Stack Up
District of Columbia leads all states, with 245 doses per 100 people
Doses per 100 people: 250
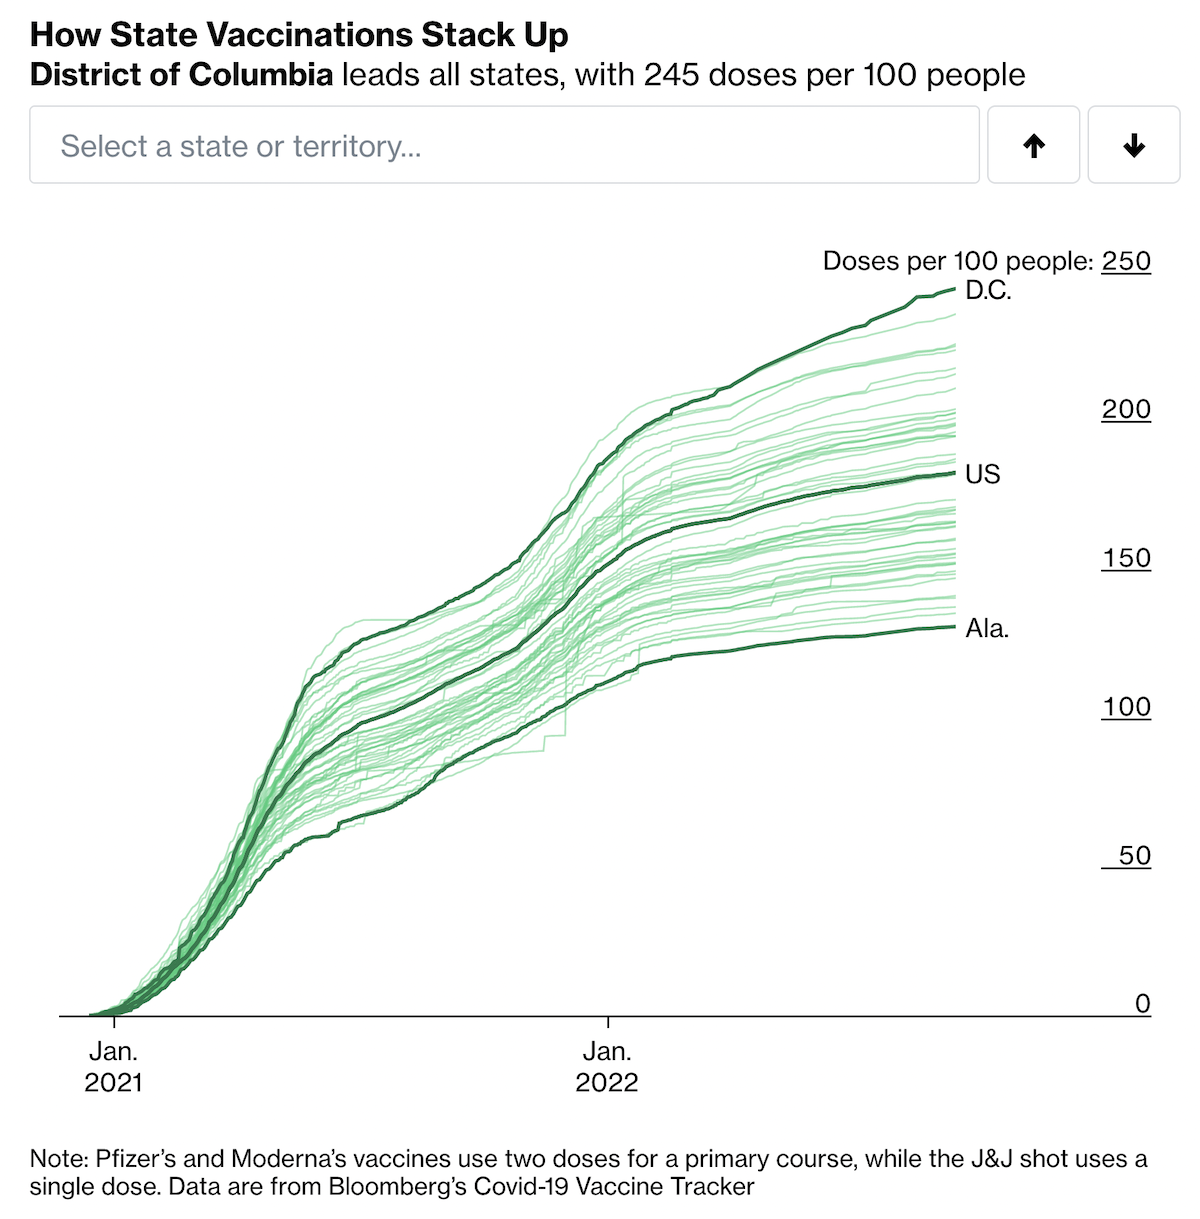
Note: Pfizer’s and Moderna’s vaccines use two doses for a primary course, while the J&J shot uses a single dose. Data are from Bloomberg’s Covid-19 Vaccine Tracker
The future of Covid-19 is uncertain. Scientists describe two paths it could take. Future variants could continue to moderate into a seasonal respiratory illness similar to the flu. Alternatively, a more deadly variant could emerge, perhaps combining the virulence of delta with the transmissibility of omicron.
The Path to Immunity in the US
In the US, the latest vaccination rate is 261,820 doses per day, on average. At this point, 79% of the population has had at least one shot.
United States (has 79% coverage)
Doses administered: 8 M
Note: Data are from Bloomberg’s Covid-19 Vaccine Tracker.
US Vaccination Campaign
| % of population | |||||||
|---|---|---|---|---|---|---|---|
| Jurisdiction | Doses administered | per 100 people | given 1+ dose | fully vaccinated | booster dose | Daily rate of doses administered | Supply used |
| US Totals | 612,825,646 | 182.8 | 78.6 | 67.0 | 32.5 | 261,820 | 73.5% |
| California | 80,172,163 | 202.8 | 84.2 | 73.6 | 41.1 | 39,060 | 77.9% |
| Texas | 48,406,066 | 166.1 | 74.3 | 61.8 | 23.1 | 14,497 | 69.0% |
| New York | 41,241,407 | 204.2 | 88.8 | 75.7 | 35.8 | 20,252 | 79.0% |
| Florida | 39,453,696 | 183.2 | 80.8 | 68.1 | 28.9 | 17,569 | 72.6% |
| Pennsylvania | 24,571,828 | 189.0 | 86.4 | 69.6 | 31.1 | 5,666 | 68.9% |
| Illinois | 24,007,969 | 187.4 | 76.5 | 68.9 | 37.8 | 16,461 | 75.7% |
| Federal Entities* | 19,409,186 | – | – | – | – | 2,100 | 98.6% |
| Ohio | 18,949,762 | 160.6 | 63.9 | 58.8 | 32.2 | 9,367 | 70.8% |
| New Jersey | 18,111,476 | 195.0 | 88.4 | 73.8 | 36.8 | 8 | 71.6% |
| North Carolina | 17,765,853 | 170.2 | 88.0 | 64.0 | 18.5 | 10,886 | 69.5% |
| Virginia | 17,522,728 | 203.0 | 87.1 | 73.9 | 37.8 | 10,670 | 77.6% |
| Michigan | 16,758,098 | 166.3 | 67.5 | 60.6 | 34.2 | 1,429 | 67.6% |
| Massachusetts | 15,891,234 | 226.1 | 99.6 | 79.5 | 42.7 | 12,433 | 81.7% |
| Georgia | 15,771,880 | 147.2 | 66.5 | 55.6 | 22.8 | 6,506 | 63.3% |
| Washington | 15,497,444 | 201.1 | 82.0 | 73.0 | 40.7 | 8,450 | 74.6% |
| Maryland | 13,045,598 | 211.2 | 87.2 | 75.9 | 41.3 | 9,921 | 70.0% |
| Arizona | 13,030,381 | 182.2 | 77.0 | 64.4 | 29.1 | 7,379 | 77.0% |
| Colorado | 11,513,880 | 199.4 | 81.3 | 71.5 | 39.6 | 5,792 | 79.4% |
| Minnesota | 11,125,076 | 195.0 | 76.0 | 69.6 | 42.1 | 4,604 | 74.5% |
More Coverage From Bloomberg
- Sign up for our daily coronavirus newsletter
- The Covid Resilience Ranking
- What We Know About Omicron, the New Virus Variant: QuickTake
- What the World Knows (and Doesn’t) About the Omicron Covid Variant
- Why China Is Sticking With Its ‘Covid Zero’ Strategy
- Stories about the pandemic from Bloomberg News

